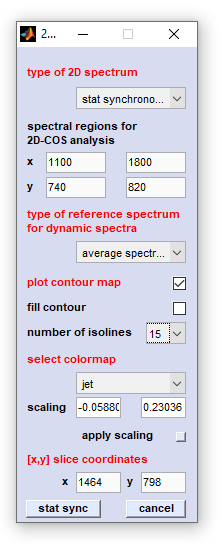
Options of the 2D-COS Control Window
Type of 2D spectrum: defines the type of the 2D-COS analysis. Valid options are:
   * Pearson scaling - the synchronous 2D spectrum with Pearson,
     or unit variance scaling. Pearson scaling is also used in
     statistical total correlation spectroscopy [STOCSY] and
     statistical heterospectroscopy [SHY])
   * Pareto scale 0.75 - the synchronous 2D spectrum with Pareto
     scaling. The parameter α equals 0.75
   * Pareto scale 0.50 - the synchronous 2D spectrum with Pareto
     scaling. The parameter α equals 0.50 (Pareto scaling
     in the strict sense)
   * Pareto scale 0.25 - the synchronous 2D spectrum with Pareto
     scaling. The parameter α equals 0.25
   * stat synchronous - the classical synchronous 2D (covariance)
     spectrum
   * stat asynchronous - the classical asynchronous 2D spectrum
   * disrelation - allows to calculate the absolute of the 2D
     disrelation spectrum
   * fft synchronous - alternative implementation to obtain the
     synchronous 2D correlation spectrum by means of the fast
     Fourier-transformation approach
   * fft asynchronous - alternative implementation to obtain the
     asynchronous 2D correlation spectrum by means of the fast
     Fourier-transformation approach
Spectral regions for 2D-COS analysis: allows to define the [x,y] spectral ranges for 2D-COS analysis
Type of reference spectrum: defines the type of reference spectrum to obtain the dynamic spectrum. Valid options are no reference (spectrum), average spectrum (default), first spectrum and last spectrum.
Plot contour map: plots a contour map instead of an interpolated surface map where the color is proportional to the 2D-COS functional values.
Fill contour: creates a filled contour map
Number of isolines: defines the number of isolines in contour / filled contour maps
Select colormap: the type of color maps used to plot surface maps, or to plot the isolines in contour maps
Scaling: permits to modify manually the color map by entering the minimal and maximal z-values into the appropriate edit boxes
Apply scaling: color map scaling values are immediately applied to the 2D correlation spectrum
[x,y] slice coordinates: settings required to plot 1D correlation slices, or to create [x,y] feature plots
