Excel Trace Format and Matlab Imaging Format: Difference between pages
No edit summary |
|||
| Line 1: | Line 1: | ||
Imaging data can be considered 3-way data in which the intensity (absorbance, transmittance, reflectance, etc.) depends on two spatial [x,y] variables and one spectral variable, usually represented by the wavelength, wavenumber, or Raman shift. <br> <br> | |||
[[File:imaging-file-format-I.jpg|400px|thumb| Matlab structure arrays ''C'' (imaging data) and ''Minfo'' (metadata) present in imaging data files]] | |||
To load | To load imaging data in the Matlab data format select ''Load Data'' → ''Matlab imaging format'' → ''x-data'' or ''y-data'' to load the x-, or y-data from the ''Load Data'' menu bar. Matlab imaging data files may contain up to four different types of hyperspectral imaging data cubes: original (unprocessed data), pre-processed, derivative and so-called deconvolution data cubes (the latter 3 types of data must be derived from the original spectral data). For a detailed description of the Matlab imaging data format see [http://www.cytospec.com/file.php#FileSaveMatlab]. | ||
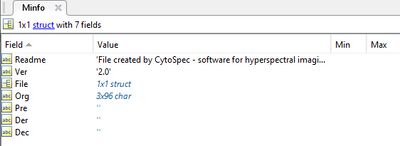
[[File:imaging-file-format-II.jpg|400px|thumb| Fields of the Matlab structure array ''Minfo'' containing important metadata of hyperspectral imaging data files]] | |||
== Related links == | |||
* [[Matlab_Trace_Format|Import data in the trace format (Matlab)]] | |||
* [[Excel_Trace_Format|Import data in the MS excel data format]] | |||
* [[Format_of_a_2D-COS_Result_File|Format of a 2D-COS result file (Matlab)]] | |||
Revision as of 16:58, 2 April 2023
Imaging data can be considered 3-way data in which the intensity (absorbance, transmittance, reflectance, etc.) depends on two spatial [x,y] variables and one spectral variable, usually represented by the wavelength, wavenumber, or Raman shift.
To load imaging data in the Matlab data format select Load Data → Matlab imaging format → x-data or y-data to load the x-, or y-data from the Load Data menu bar. Matlab imaging data files may contain up to four different types of hyperspectral imaging data cubes: original (unprocessed data), pre-processed, derivative and so-called deconvolution data cubes (the latter 3 types of data must be derived from the original spectral data). For a detailed description of the Matlab imaging data format see [1].

